Recently I was having a chat to a fundraiser who asked me for some advice about an acquisition campaign they were working on. In essence it’s a digital lead generation with a telemarketing conversion to regular giving. The type of campaign used by plenty of charities with varying degrees of success depending on the lead source and success of the conversion campaign.
My fundraising colleague then asked me what I thought – should they proceed with the campaign? I wanted to know more so I asked a few questions about the campaign including the costs and the key metrics they expected for the campaign such as average gift, attrition rates, declines and so on.
Whilst we were on the call, I quickly jumped into the GivingInsight forecasting module and having plugged in all the key metrics was able to run the numbers as we talked. There was a bit of silence at the end of the phone when I told them that, based on the information provided the campaign wouldn’t break even until the 7th year!
One of the questions I’m often asked when talking about lead generation campaigns is what is an acceptable cost per donor? Often this is tied to a point around benchmarking where a benchmarked cost per donor is quoted as being an acceptable cost.
I think the more pertinent question is: when will the campaign break even and what’s the return on investment over a specified period?
If your organisation is investing in acquisition what does your Board, CEO or CFO expect in terms of return and over what timescale? Actually, what do you as a fundraiser think is acceptable? I ask that question because I think there is a risk that, with challenges across all acquisition channels at the moment, there is a temptation to run an acquisition campaign even if the returns may be lower than those we have been used to in the past.
Is a break even at seven years or five or four acceptable? Is it okay to wait that long until our beneficiaries see some tangible benefit for the investment made in fundraising? That’s a question for each organisation to answer dependent on their individual policies but it is one that should be at the core of your investment decisions.
These conversations about 2-step campaigns got me thinking about how we go about developing a business case, writing a budget or a forecast for a new strategy so we are clear about long term outcomes of fundraising investment decisions.
As some of you are going into budget season, I thought it would be useful to work through some ideas around forecasting a 2-step program and making informed decisions about whether to proceed.
Of course, lead generation/2-step is just one of many regular giving acquisition options you have but as it is such a popular acquisition channel at the moment, I thought it would be a good starting point. Plus, much of what applies to 2-step equally applies to other regular giving acquisition channels.
Before we go any further let’s talk about terminology and what I define as 2-step as these campaigns can be called different names depending on where in the world you are!
2-Step is a campaign whereby you are collecting leads via a digital campaign such as Facebook advertising, survey leads, petitions, value exchange and so on. These leads are then phoned, normally by a telemarketing agency and asked to convert to a regular giving donor (also known as a recurring or sustainer donor again, depending where in the world you are!)
So, how do we go about the process of building a forecast to help us decide where to direct our fundraising investment?
Our starting point is to think about the core metrics we need to consider when running a 2-Step forecast and where to find them?
The main ingredients are:
- The number of donors you will acquire each month
- Cost of acquiring each donor (cost per acquisition/cost per donor)
- Average gift each month
- Pre-debit fail rate
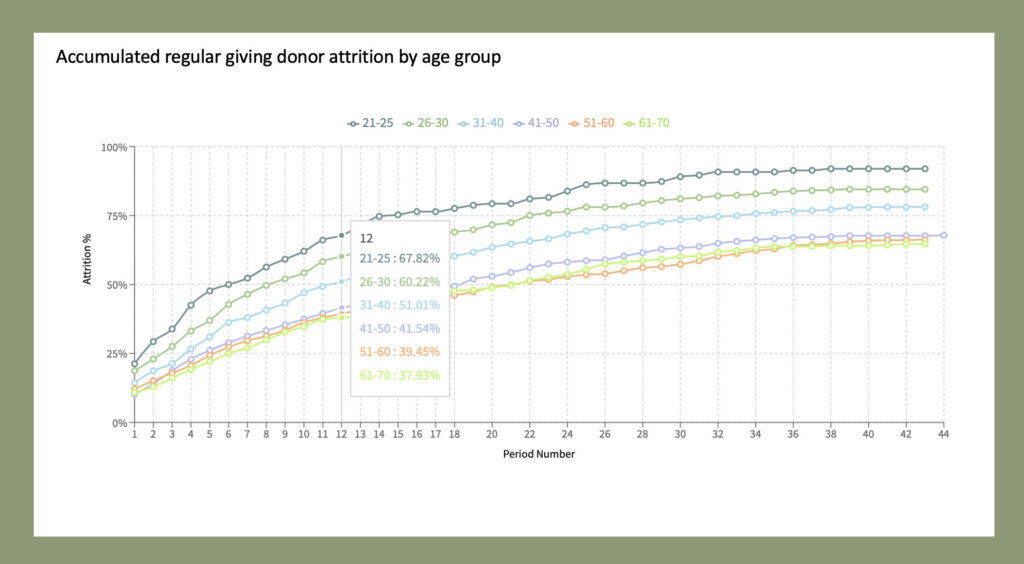
- Attrition rates month on month
- Declined transaction rates each month
If you want to add to these, you can consider adding costs such as communications costs that sit in the donor journey or by including transaction costs. Additionally, you might want to account for donors who make their first gift in the month of acquisition and those who make it the month after. Over and above that, consider if you want to include upgrades too.
Revenue is the amount received each month from successful transactions. The amount of revenue received is influenced by:
- Volume of donors acquired and when they were acquired in the budget year; the closer to the start of the year (calendar or financial), the more instalments you will receive
- Number of transactions per year
- If you transact every four weeks rather than monthly for example you will receive 13 gifts per year rather than 12
- If you acquire more supporters early in the budget year, revenue in the budget year will likely be higher as you’ll have had the opportunity to receive more instalments/transactions in the period than if supporters were acquired later in the budget year
- Average gift per donor and any future upgrades in donation value
- Pre-debit fail rate
- These are the donors who sign up but cancel their gift before you process the first transaction run
- Attrition rate
- These are the donors lost through cancellation
- Declines
- These are the unsuccessful transactions each month and can be due to a variety of reasons such as expired credit card, no money in the account and so on.
- Some of these are de facto cancellations as a donor will often cancel their direct debit and not tell you only showing up as a declined transaction
Expenses are those costs that you apply to the campaign. Each organisation is different but the cost of acquiring a donor is the biggest cost. You could also apply staff costs, donor journey and transactions costs too if you .
As we are looking at a 2-Step campaign it is worth looking at the components that make up the cost per acquisition/donor. In summary these are:
- Campaign Costs e.g.
- Design
- Copywriting
- Consultancy
- Agency fees
- Media costs
- Third party platform costs
- Lead generation costs
- The cost of purchasing the lead from a broker or provider
- The cost of generating a lead on e.g. Facebook or other social media channels through advertising
- Media management costs
- Calling costs
- Telemarketing agency fees
Influencers of Acquisition Cost
Acquisition costs are influenced by a number of things and these include:
- The number of donors that can be attributed to the campaign
- The quality of the leads – each lead source will have different outcomes so track them so you know what is working and what is not; that way you can add or drop lead sources to improve ROI
- Calling costs – the more donors converted from a given number of calls the lower the CPA
- Calling quality – different telemarketing agencies may give different results even with similar calling data
In terms of outcomes from your investment you’ll want to know:
- Total revenue over a given period of time
- The total expense for your campaign
- The number and value of any cash gifts received
- You can use these to offset acquisition costs
- Net revenue and cumulative net revenue
- The break-even month
- The ROI at specific points in the campaign e.g. 1 year, 3 year, 5 year, 10 year
So how do we run a forecast in practical terms? I use the GivingInsight module to run a forecast. For years I’ve been using excel models, but the GivingInsight module has made it easier to both run the forecast and compare different scenarios. I’m able to plug in all the metrics and see the outcomes in just a few minutes.
Let’s take a look at a scenario I recently ran for a client who wanted to see the outcomes of a 2-step campaign using some typical data that I see in the GivingInsight analytics app.
I used benchmark data from GivingInsight of 2-Step campaigns to guide the metrics above and whilst there are programs with better metrics there are also those that are performing so well, so I think the balance here is about right. There are a lot of data points I was able to look at and come up with a typical set of inputs. Remember every organisation will have different experiences!
I’ve kept it straightforward and not added complexity, although the GivingInsight forecasting module does allow quite a few variations to be added in and give you plenty of options for covering all your
The scenario that I ran was for acquisition of 100 donors per month for a single year.
In terms of core metrics, pre-debit fail rate is set at 5%; the cost per acquisition is $430.00; Year one attrition is 35% (subsequent years are calculated based on year one using GivingInsight data); declines set at 12% in year one (with a reduction each year in line with data we see in GivingInsight); and no upgrade included (bear in mind this adds costs in the future of the program).
In an acquisition campaign like this you are likely to receive one off gifts. How do you deal with them? One way is to use them to offset your costs and that will help lower your cost per donor.
Important to note that for this forecast I have used data from the Australian market and currency is AUD. How a program like this performs will depend on the market you are in of course but the forecasting principles are the same wherever you are.
So, what is the outcome of this forecast?
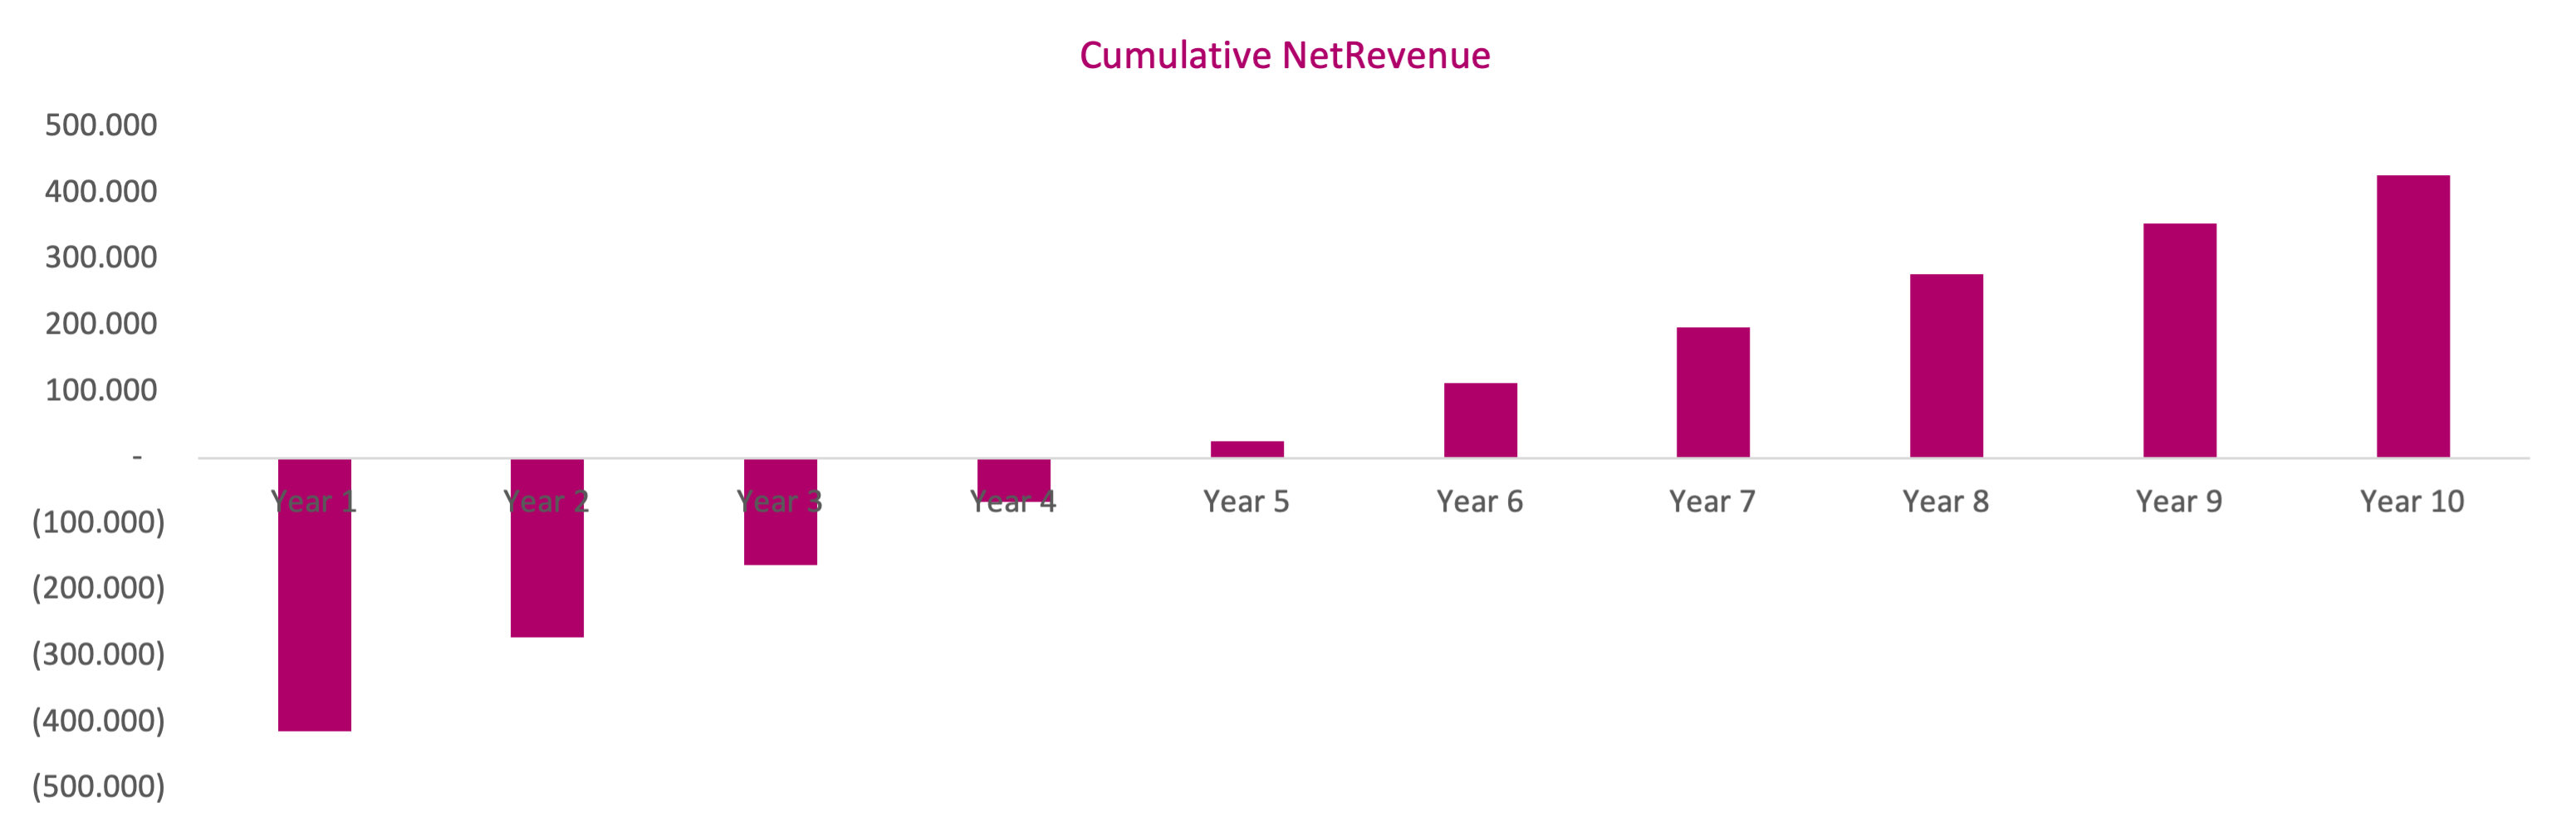
The chart below shows the cumulative net revenue outcome for the one year of acquisition. You’ll see from the chart below the break-even is in year five (actually in the 57th month).
The chart shows net revenue over ten years. It is useful to consider that the regular giving program has a long tail and so revenue will continue to be received from the most loyal donors over a long period of time. That might be a consideration when evaluating investment in the program.
Having seen the results what are the key takeaways and considerations?
- The breakeven is in the fifth year of the program
- Over ten years the program raises $943,000 for a spend of $516,000 giving a profit of $427,000
- By the end of the fifth year the profit is $25,000
There are a few key questions to ask when considering a new campaign or to continue an existing one:
- Do you think the break even period is too long, short or about right?
- Would the ROI meet the expectation of the organisation?
- What additional revenue might be received from the donors acquired and in what quantity and how can they be accurately calculated?
- g. upgrades; middle or major gifts; bequest/legacy gifts and so on
- Are there alternative options that will provide a better ROI?
- e. where is the best place to direct fundraising investment?
- Benchmark this campaign against your own data for other channels or campaigns to make investment decisions (you can do this in GivingInsight)
- What is an acceptable ROI and break-even point for the campaign and based on available data and forecasting will it be achieved?
- What actions could you take to improve the ROI such as improved retention and declined transactions and can you adjust the forecast to suit?
- As with all acquisition programs, think about the long term retention activities to improve supporter engagement and improved ROI
One of the benefits of using a forecasting tool like GivingInsight is that you can run different scenarios alongside each other to compare and contrast them. For example, you might want to compare different channels, suppliers or look at best/mid/worst case scenario.
Where to find the information to inform the metrics you choose for your forecast?
When preparing your forecast, you will want to get as much data as possible to help define your metrics. Amongst the many options are:
- Find this in your existing data – if you are already running similar programs, you will have this in your CRM – quick plug (!) GivingInsight gives all of this in a user-friendly dashboard
- Talk to your colleagues and friends in fundraising (always a great source of information) and get a sense of what they are achieving
- Use benchmarking data to see how campaigns such as these perform in other organisation and see if this aligns with your own experience
A final word from me. It is so important to take the opportunity to compare all your acquisition options to make sure that the investment your board has signed off is used to get the best ROI as possible. Would I go for the campaign above? Probably not but that is only because the data I see tells me that there are other options to consider that will perform better. Having said that I know there are 2-step campaigns that are performing better but, the data (and it always comes back to the data!) tells me that 2-step is not always the best option.
Spend the time looking at the data and using it to inform your forecasting and you won’t go far wrong.